
September 2026 housing snapshot
SDAR reports, current as of October 5, 2026. Source checked November 1, 2026.
| Report geography | Home type | Closed sales | Median sale price | Days on market until sale | Homes for sale | Months of supply |
|---|---|---|---|---|---|---|
| 91977 — Spring Valley | Detached | 19 | $835,000 | 40 | 50 | 2.0 |
| 91977 — Spring Valley | Attached | 8 | $554,250 | 42 | 26 | 3.2 |
In Spring Valley, the September 2026 detached and attached figures were close on time to sale (40 and 42 days) despite different inventory levels. Compare homes of the same type before using that timing to plan a listing.
These are September monthly figures, not year-to-date totals or rolling 12-month medians. Inventory is the report-period count, not a live list of homes available today. Sale-price figures do not account for concessions or downpayment assistance. A ZIP-level median is context for a market discussion, not a valuation of a particular home.
Small samples: 91977 attached: 8 closed sale(s). A small number of different homes can shift the median substantially; do not treat these figures as a stable price trend.
Source: Greater San Diego Association of REALTORS® / San Diego MLS, Local Market Updates. 91977 September report
Historical snapshot: July 2026
The July figures and commentary below are retained for historical reference. They are not the latest reporting period shown on this page.
July 2026 91977 / Spring Valley market snapshot. This page separates detached-home activity from attached-home activity because the two segments can move differently. It is a local context tool, not a valuation, forecast, or recommendation for a particular property.
What the July 2026 91977 report shows
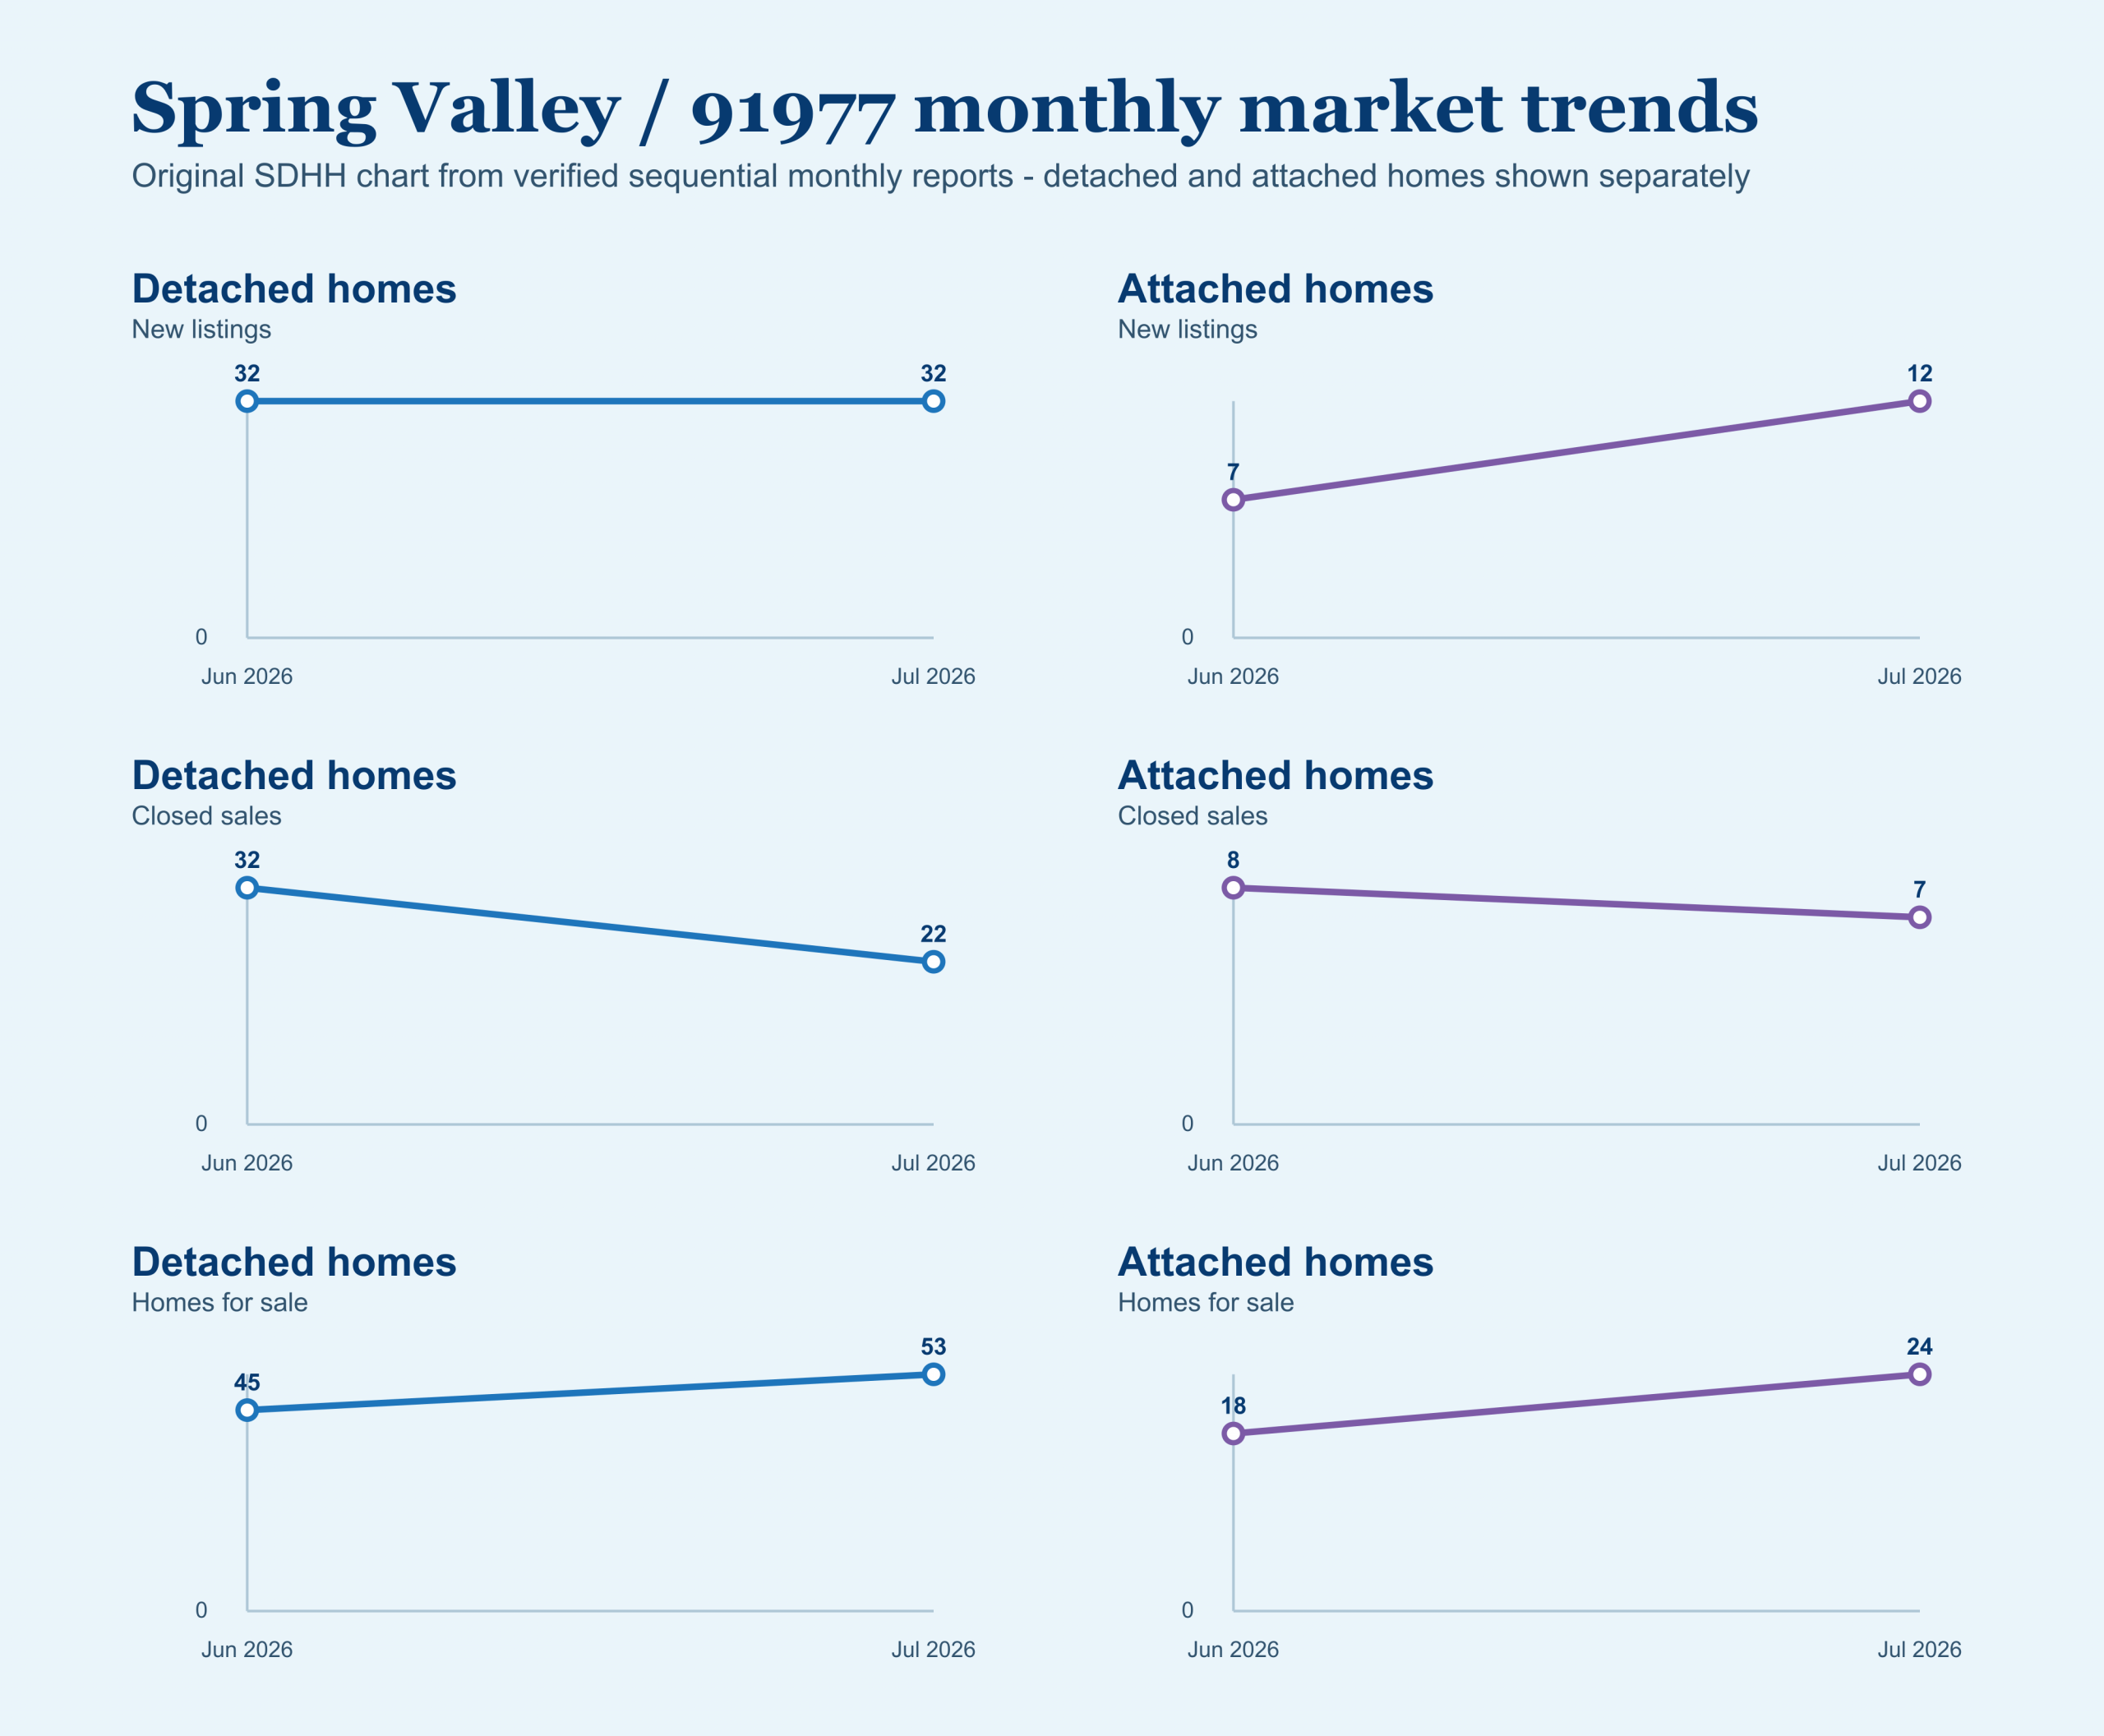
For detached homes, July recorded 32 new listings, 21 pending sales, and 22 closed sales. The median sales price was $802,500, with 53 homes for sale and 1.9 months of supply. The report shows 32 days on market until sale and 98.2% of original list price received.
For attached homes, July recorded 12 new listings, 6 pending sales, and 7 closed sales. The median sales price was $587,500, with 24 homes for sale and 3.0 months of supply. The report shows 36 days on market until sale and 95.6% of original list price received.
| July 2026 metric | Detached homes | Attached homes |
|---|---|---|
| New listings | 32 | 12 |
| Pending sales | 21 | 6 |
| Closed sales | 22 | 7 |
| Median sales price* | $802,500 | $587,500 |
| Percent of original list price received* | 98.2% | 95.6% |
| Days on market until sale | 32 | 36 |
| Homes for sale | 53 | 24 |
| Months supply of inventory | 1.9 | 3.0 |
June-to-July activity at a glance
How to use a ZIP-level snapshot
The detached and attached figures are separate markets. The attached segment had seven July closings, so a small number of sales can move a median or percentage noticeably. Use the report to form questions about current competition and recent comparable sales, not to assign a value or a likely outcome to a particular property.
For a sale decision, compare the property with its current competition, recent relevant sales, condition, access, preparation needs, and likely buyer pool. Start with the broader San Diego market-conditions overview, then use a property-specific review to test how much of the 91977 snapshot applies.
Plan a Spring Valley sale around the actual property
Use the pre-listing home-preparation checklist to organize the work before a launch. For a seller-focused conversation about your property and timing, Book a 30-minute pricing and positioning review, call (619) 497-1834, or contact San Diego House Hunting.
This page provides general educational information, not legal, tax, financial, appraisal, or investment advice. Market conditions and individual sale decisions are situation-specific.